How To Use Virtual Gating To Achieve Optimal Measurement Results
Virtual gating enables fine-tuning of the delay range of interest. Let’s have a look at what virtual gate adjustments are and how they affect measurement results.
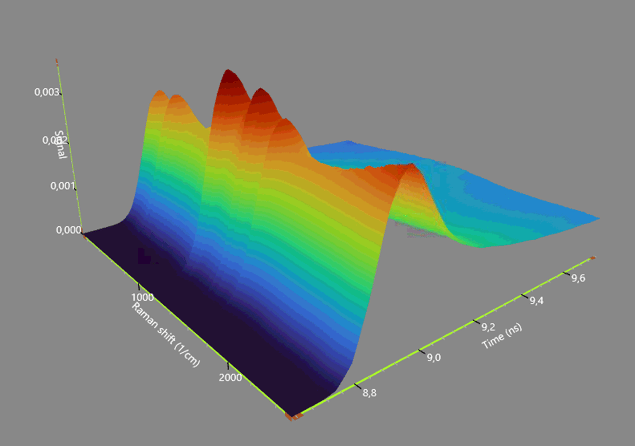
A time-resolved spectrum with signal (intensity), Raman shift, and delay (time) axes. Raman responses can be observed at the peak of the emission pulse. The delay range of this measurement was slightly over one nanosecond (8.63 – 9.75 ns).
The aim of using Timegated® Raman spectroscopy is usually to include a delay range where most of the Raman intensity is located while excluding most of the fluorescence interference that has different temporal distribution characteristics. In practice, this usually means including an early part of the emission pulse, while excluding a later part of the emission pulse from the studied data.
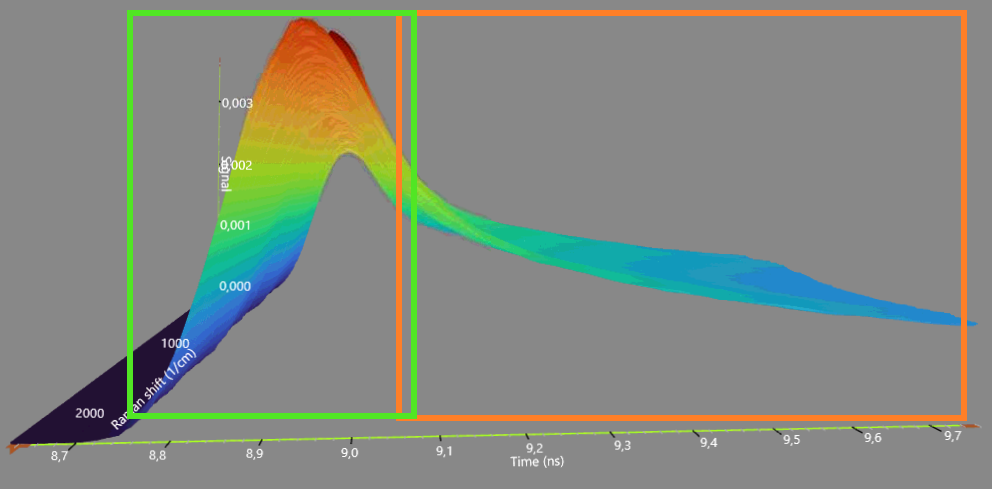
Raman responses can be observed in the early phases of the emission pulse (green box). Most of the fluorescence can be observed in the later parts of the delay range (orange box). The overlap of Raman and fluorescence depends on the fluorescence characteristics (varies depending on the sample).
A measurement usually consists of a delay range of over a nanosecond. The user can then use the virtual gate settings to narrow down the range that should be included in the resulting spectra. Some of the effects of adjusting the delay range with virtual gating are shown in the figures below. The virtual gate range can be adjusted and iterated even after finishing a measurement provided the gate bounds are within the delay range of the original measurement.
When the virtual gate range is shortened to only include the first parts of the emission pulse, fluorescence is excluded. If the delay range is shortened even further towards the beginning of the emission pulse, more and more of the Raman response is excluded from the data (overlapping fluorescence is also excluded). The potential overlap of fluorescence and Raman responses often depends on the fluorescence characteristics. In some cases, fast fluorescence may have significant overlap with Raman, and choosing a delay range may become a balancing act of trying to exclude as much fluorescence interference as possible while cutting a minimal amount of the Raman responses.
A 2D Timegated® spectrum is achieved by averaging or summing data from a specified virtual gate range:
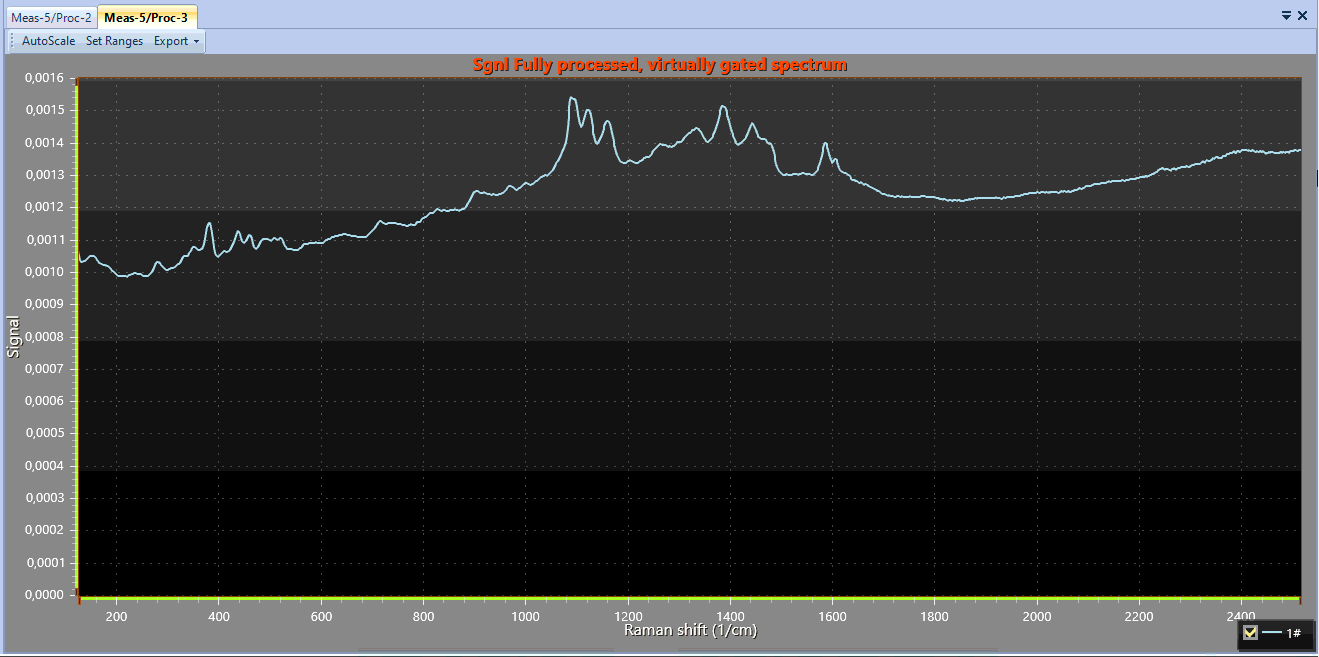
Yellow paper: 8.75 - 9.75 ns virtual gate delay range.
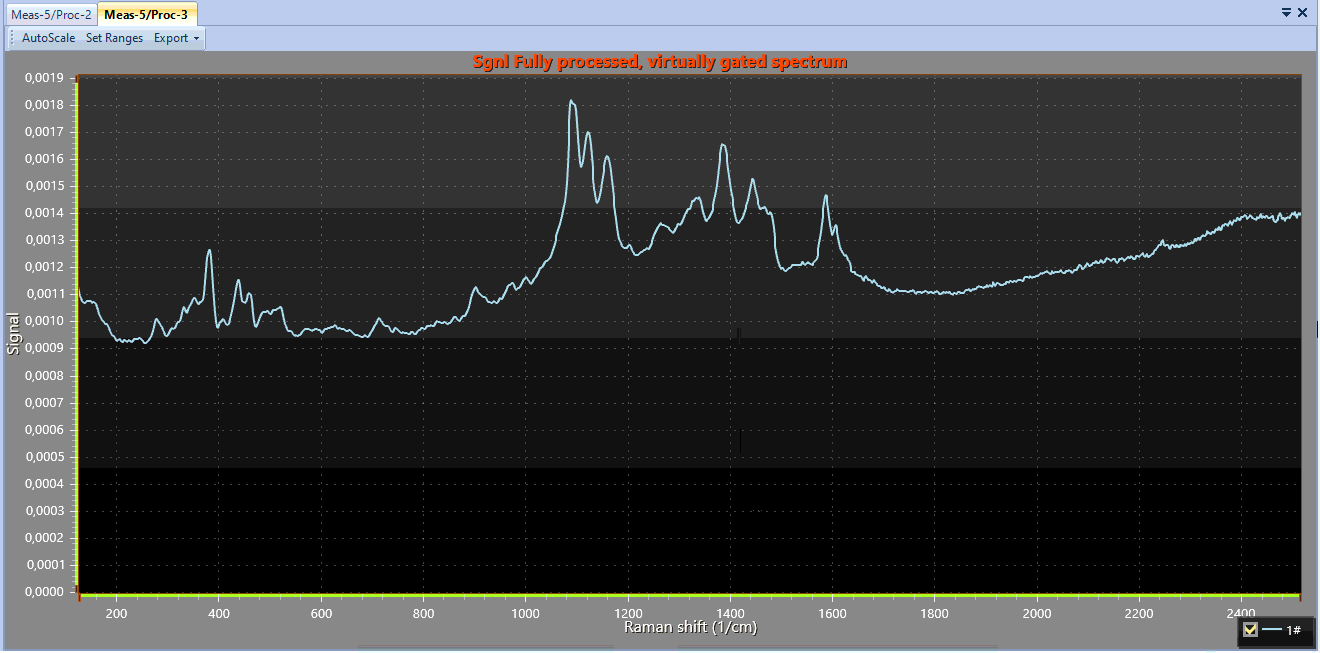
Yellow paper: 8.75 - 8.95 ns virtual gate delay range. The Raman peaks are better defined and more prominent with this shorter delay range.
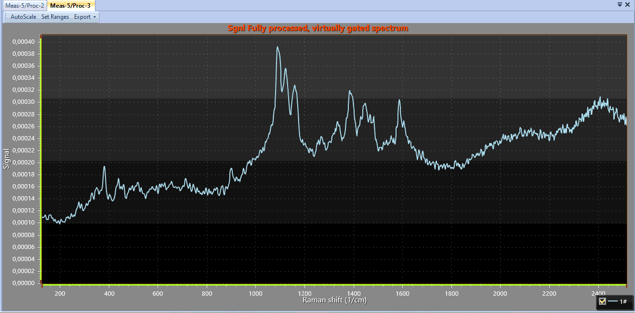
Yellow paper: 8.75 - 8.82 ns virtual gate delay range. Note the lowest baseline level as this range includes the lowest amount of fluorescence interference. The spectrum is also noisier as this very short delay range excludes a significant portion of the Raman responses. The noise level could be improved by increasing the measurement length.

The virtual gate limits can be easily adjusted in the measurement UI.
Most users are aiming for a result where the Raman-to-fluorescence ratio is as high as possible. As shown in the figures above, we can observe clear differences with Timegated® Raman spectroscopy even when making small delay adjustments in the sub-nanosecond range. While these changes are significant in the scale of Timegated® Raman, they are minuscule in the scale of conventional Raman spectroscopy. Even the delay range of over a nanosecond often excludes a significant amount of fluorescence and other photoluminescence interferences like phosphorescence that may be interfering with conventional Raman spectroscopy and virtual gating helps to fine-tune and optimize these Timegated® results even further.
Author
 This blog was written by Timegate Instruments’ Application Team Lead Bryan Heilala. Bryan is a young and energetic chemist with a degree in M.Sc. (chemistry) and experience and background in analytical chemistry. Read more about him and the whole Timegate team.

