FAQ: What is the Lowest Concentration that can be Detected by the PicoRaman M3 Spectrometer?
The short answer to this question is that there is no universal lower limit to what concentration the instrument can detect. This parameter, often referred to as the limit of detection (LoD) or detection limit (DL), will depend entirely on the samples in question and the measurement settings. Let's explore the topic in more detail.
Understanding the Limit of Detection (LoD)
We can think of the LoD as the point where the analyte signal exceeds noise. In this context, noise encompasses all spectral signals that do not result from our analyte. This includes, for example, instrumental noise, fluorescence, and overlapping Raman signals from other components present in the sample. In other words, the LoD depends not only on the analyte of interest but also on the sample's chemical composition as a whole. For example, during a bioreactor run, glucose may have a higher LoD in the later stages of the process when the cell density is higher and thus the sample is more fluorescent.
How Measurement Settings Impact LoD
Measurement settings can also affect the LoD. For example, the sample might be sensitive to the excitation laser and the reduction of laser power which in turn results in lowered Raman signal intensities. The measurement length is also an important factor: longer measurements usually result in lower noise levels and thus lower LoD.
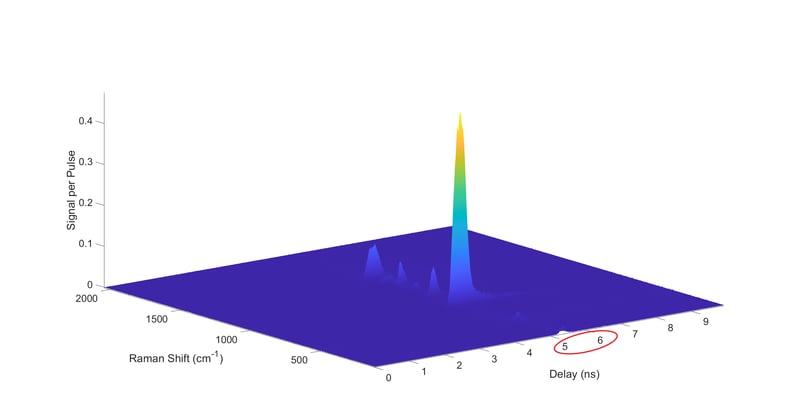
Timegated® Raman Technology may provide an advantage compared with conventional Raman by reducing noise and signal “swamping” caused by fluorescence or thermal interference. Time-gating may also enable the use of shorter wavelength excitation by reducing fluorescence interference which usually leads to higher Raman intensities.
Practical Steps for Defining the LoD
In practice, to define the LoD for a specific analyte and sample matrix, you need a set of samples with varying concentrations of the analyte. The concentration range must be low and include concentration values that approach the LoD. The more dense the concentration range in the vicinity of the LoD, the more accurate the estimation will be. The set should also include blank samples: samples where the analyte of interest is completely absent. The Raman spectra corresponding to these samples, once preprocessed using baseline correction and normalization can then be used to calculate the LoD.
Methods for Calculating the LoD
Because Raman spectroscopy results in multivariate data, there are several ways to approach calculating the LoD, and the result will sometimes differ greatly depending on the chosen method. The idea is to find the concentration at which the Raman spectrum resembles that of a blank sample, plus a given margin. The magnitude of the margin determines the probability of false positives and negatives at the LoD.
One approach is to simply compare the spectra at different concentrations visually: what is the lowest concentration at which the analyte peaks are visible? This is of course an inexact approach with room for subjectivity, and a method based on quantitative analysis is often preferred. This means having some function or model to relate the spectral data to the concentration of the analyte. The LoD is then calculated by determining what concentration the function will assign to a standard blank sample with the standard amount of noise (again, plus a given margin). This is then interpreted as the LoD, as the model cannot reliably detect the presence of the analyte below this point.
The function in question will depend on how you utilize the spectral data. One option is to choose a single relevant variable from the spectrum, for example, the analyte’s highest peak, to analyze. Then a simple univariate linear function is sufficient. However, using a single point on the spectrum does not capture the entirety of the analyte signal, and LoD values calculated this way may be overestimated. Using the whole Raman spectrum, or at least some relevant region of it, captures more of the analyte signal, but necessitates the use of multivariate models like PLS. The model regression vector is then used in the LoD calculations. Alternatively, the multivariate information can be condensed into a single variable, for example by taking the area under the relevant analyte peaks. Then a simple linear model would again suffice.
LoD and LoQ
It is important to note that, no matter the complexity of the function used, the LoD estimate will be affected by model uncertainty as well as instrument and sample-related noise. For a more conservative estimate, this can be addressed by adding the model uncertainty to the LoD. Furthermore, the LoD merely gives the lowest reliably detectable concentration, which is not necessarily a concentration at which reliable quantitative analysis can be done. For this there exists a distinct but related parameter, the limit of quantitation (LoQ) or quantitation limit (QL), which is often as a rule of thumb 3 or 3.3 times the LoD.
Example: Determining LoD for Glucose in Bioprocessing Media Using the PicoRaman M3 Spectrometer
Again, no universal LoD can be given for the PicoRaman M3 spectrometer, but we can give an example in the case of glucose. Glucose was diluted in bioprocessing media at concentrations of 0, 1, 2, 3, 4, 5, and 6 g/L, and based on visual inspection of the spectra, we were able to see that the LoD was less than 1 g/L. We then made a statistical estimate for the exact value of the LoD. A PLS model was built with the samples’ Raman spectra, and using the regression vector of the model, the LoD was calculated to be approximately 0.03 g/L. When allowing for the model uncertainty, the LoD for glucose in this bioprocessing media would be no greater than 0.42 g/L. However, it needs to be considered that no samples with glucose concentration at these values were included in the dataset.
Read more about our solutions for biopharma: Real-time monitoring and bioprocess control to ensure consistency in each step of biomanufacturing.
Read more
Read how to choose the correct delay range for your Timegated ® Raman measurement results.
Find our other resources, including the rest of the FAQ blogs, scientific articles, and resource bank stacked with application notes and brochures, all conveniently gathered in one place for you.


